
Metadata’s AI agents run, launch, optimize, and analyze paid ad campaigns across all channels – automatically turning ad spend into revenue.
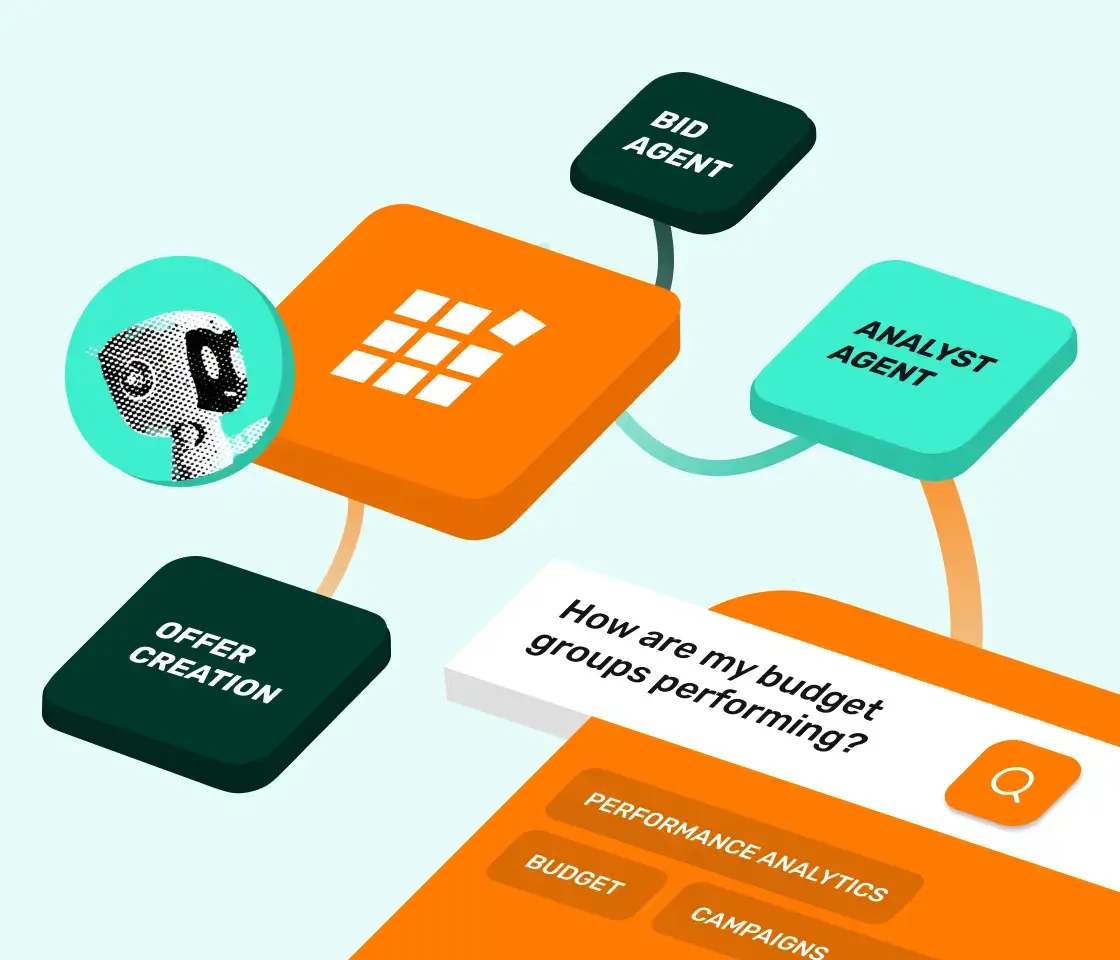
Metadata automates paid campaign execution across channels like LinkedIn, Google, Facebook, Instagram, Reddit, and X. Using AI Agents like Bid Agent and Analyst Agent help marketers launch campaigns faster, optimize ad spend, and uncover real performance insights—without needing more headcount. That means less wasted spend, lower cost-per-lead (CPL) and way less busywork. Plus more qualified pipeline and revenue.
Ditch the native channel guesswork. Metadata’s intelligent optimizer turns every ad dollar into measurable results – supercharging campaign performance, and freeing up your team’s time.
Metadata’s patented targeting, combined with cross-channel campaign management and 24/7 dynamic adjustments, drives peak engagement.
At the heart of your tech stack, Metadata delivers enriched leads to your sales team – sourced from dynamic audiences and deep funnel optimizations.

“We generated 177% increase in influenced revenue with Metadata’s Bid Agent— but honestly, the real win was the time we got back and the results we achieved.
With Analyst Agent and Campaign Upload, we stopped drowning in spreadsheets and started focusing on what actually moves the needle to drive pipeline.”

“Docebo Software for accounting firms is notoriously outdated, slow, and hard to use. Fieldguide is different – itʼs a more streamlined, cloud-first approach.”
5X
Business Growth
Fieldguide innovations and efficiencies helped Maxwell Locke & Ritter grow their practice by
“Eightfold Software for accounting firms is notoriously outdated, slow, and hard to use. Fieldguide is different – itʼs a more streamlined, cloud-first approach.”
5X
Business Growth
Fieldguide innovations and efficiencies helped Maxwell Locke & Ritter grow their practice by
Improve results and lower spend with optimized bidding on LinkedIn with automated AI-powered precision.
Build better audiences and target the right people across all paid social media platforms and Google with MetaMatch.
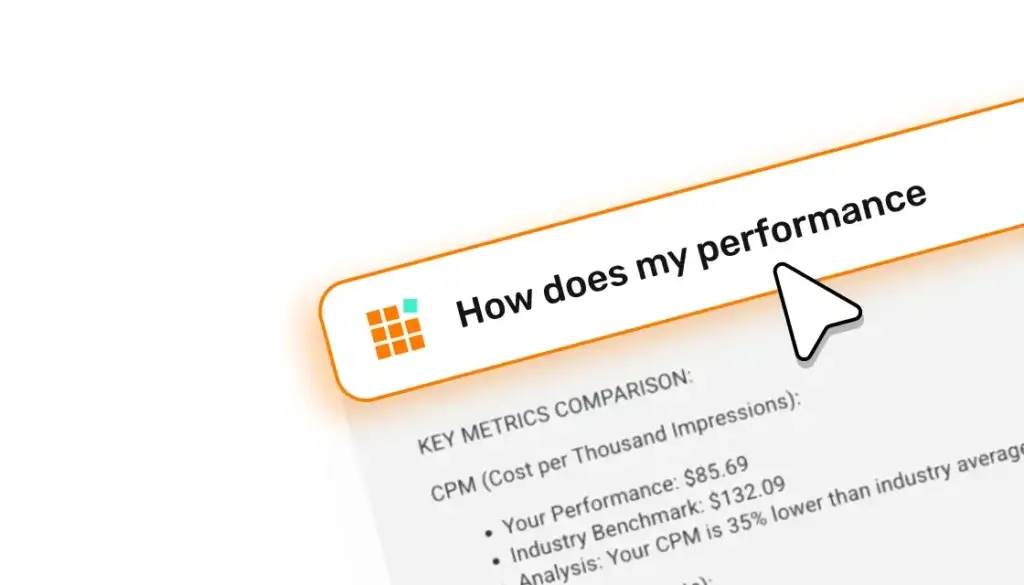
Translate ad data into real-time actionable insights and increase pipeline to drive more revenue.
Turn manual marketing into measurable revenue. Metadata’s patented targeting and agentic campaign execution drive full-funnel results across every channel.
Metadata automates paid advertising campaigns across multiple channels—like LinkedIn, Meta, and Google—for B2B marketers who want more pipeline with less busywork.
It handles targeting, bidding, creative testing, budget optimization, and reporting.
You set the strategy. Metadata’s AI agents handle the execution, 24/7, without the manual grind.
Learn more about Metadata here.
Most ad platforms stop at leads. Metadata goes all the way to revenue.
Unlike native platforms, Metadata connects directly to your CRM and marketing automation platform (MAP)—so you can track campaign performance from first impression to closed-won deal.
And while most platforms make you do the optimization, Metadata’s patented AI does it for you—automatically adjusting bids, budgets, and audiences in real time.
You stay in control by setting the KPIs that matter most to your business. Metadata handles the execution.
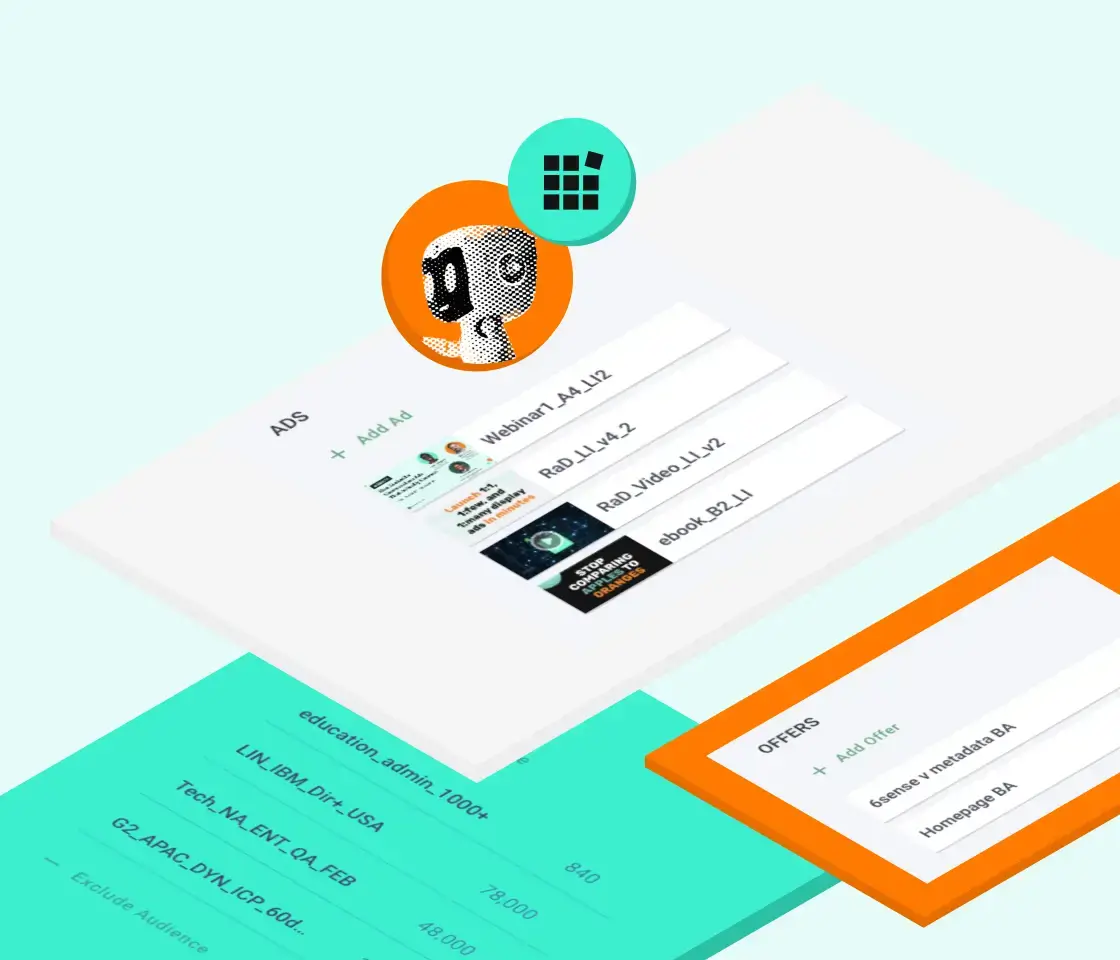
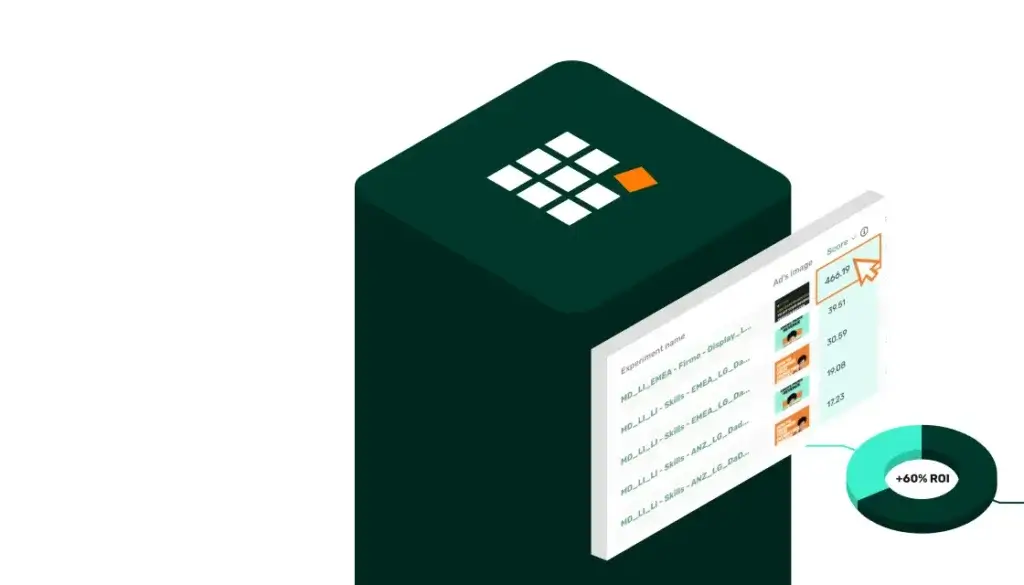
What really sets us apart? Metadata runs multivariate campaign experiments (MVT) at scale. It tests every possible combination of ad creative, audience, offer, and channel—then finds and scales what’s working.
You also get advanced reporting across campaign names, budget groups, channels, offers, and audiences—giving you the data you need to make smart adjustments and report results with confidence.
Metadata uses AI agents to automate every step of your paid campaign workflow:
You get more pipeline with less manual work.
Metadata currently automates campaigns on:
More channels are actively being added.
Metadata AI agents actively manage your ad budget and build your audiences across multiple channels in real-time, and optimizes them at scale.
MetaMatch is Metadata’s patented B2B audience engine—and one of the biggest reasons our campaigns outperform native platforms.
It connects personal and business identities across 1.5 billion matched emails, unlocking precise B2B targeting—even on platforms like Facebook and Instagram.
With multiple patents and over 10 trusted data partners, MetaMatch lets you build ultra-targeted audiences using:
The result? Higher match rates, better lead quality, and more efficient spend.
It uses real-time revenue data to automatically:
You don’t have to lift a finger. This goes way beyond cost-per-lead—Metadata continuously optimizes for true revenue optimization and revenue impact.
Most customers see improved performance within days—sometimes even hours—of launching their first campaigns.
Because Metadata automates testing, optimization, and budget allocation from day one, it quickly identifies what works and scales it.
Example:
ZoomInfo reduced cost per lead by 24%, increased pipeline, and improved performance across the board—within their first month.
Metadata integrates with:
Metadata sits at the center of your paid media stack, automating campaign execution and syncing results across your ecosystem.
Here’s a full list of integrations. And security, compliance, and privacy information.
Our customers typically:
Care about revenue impact, not just vanity metrics
We’re often compared to platforms like 6sense, Demandbase, RollWorks, and ZoomInfo.
Some marketers also choose to run campaigns directly in native platforms like Google, Meta, or LinkedIn.
But the truth is, Metadata is in a category of its own—we’re the only platform that uses AI agents to fully automate paid campaign execution from start to finish.
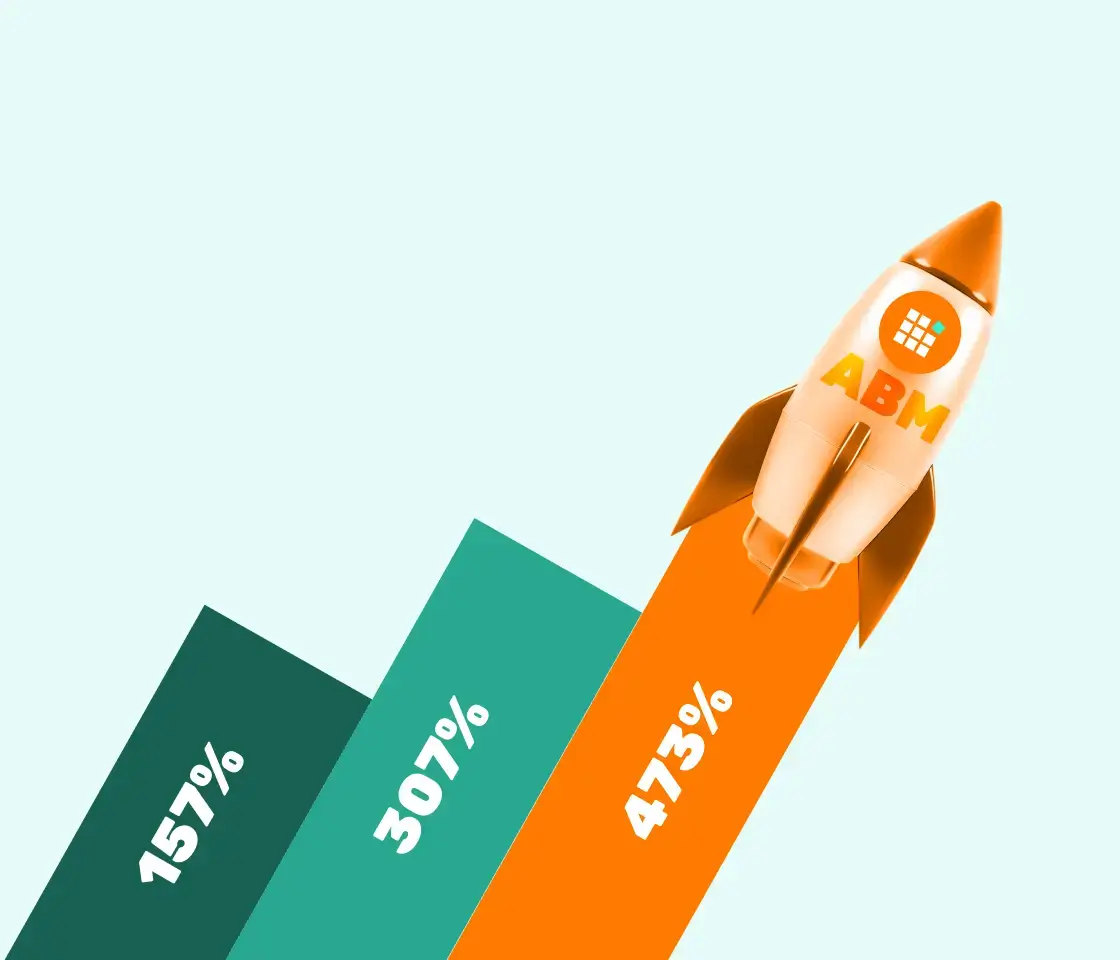
Yes Metadata is great for ABM. It enables hyper-targeted audience building, and campaigns can be optimized to specific accounts and pipeline stages.
No. While B2B demand gen leaders love us, performance marketers, paid media managers, and full-funnel teams use Metadata to streamline execution and drive measurable impact. Metadata can be used by anyone looking to optimize campaign spend and outcomes.
AI isn’t a feature at Metadata—it’s the foundation.
Today, Metadata has built over a dozen AI agents that automate:
Coming soon:
Metadata ONE will connect Metadata directly to your favorite LLMs (like ChatGPT or Claude) so you can plan, launch, and optimize campaigns through a single chat prompt.
No logins. No dashboards. Just type what you need in your LLM, and Metadata gets it done.
The future of B2B marketing is conversational, intelligent, and already in motion—and Metadata is building it.


